One of the central tenets of analytical science is that the tests conducted have been verified and can be repeated by other scientists using the same methods and equipment. In this Insight Dr. Moss and Dr. Sheard of Brookes Bell explain the science behind acceptable deviations in the specification of commodity cargoes and bunker fuel.

How analytical statistics lead to standard specifications
Published 08 January 2020
International standards organisations such as ASTM, ISO and AOAC have sought to establish often elaborately detailed methodologies to investigate a given parameter. This is critical for international commodity trade so that buyer and sellers, who are often in different countries, are confident that the quality of their product can be confirmed and the test they use, albeit in different laboratories, is acceptably equitable.
In reality, there are so many uncontrollable variables involved in material analysis between laboratories and indeed even within the same laboratory, some difference is inevitable.
Designers of analytical tests are well aware of these inherent differences and refer to it as precision. Statisticians model this as a population of possible results from a test. A result from an individual analysis will be one member of that population.
Many laboratories will be involved in establishing these methods and the statistical standard deviation, which is a quantification of how “spread-out” population values are around their average (mean). Standard deviation is calculated as the square root of variance. Variance is very simple to calculate: it is the average of the squares of the differences from the mean. The squaring is done simply to make the negative numbers positive, otherwise the negative numbers (below mean) and positive numbers (larger than mean) would cancel each other out.

Insight_BB_1
This Photo by Unknown Author is licensed under CC BY
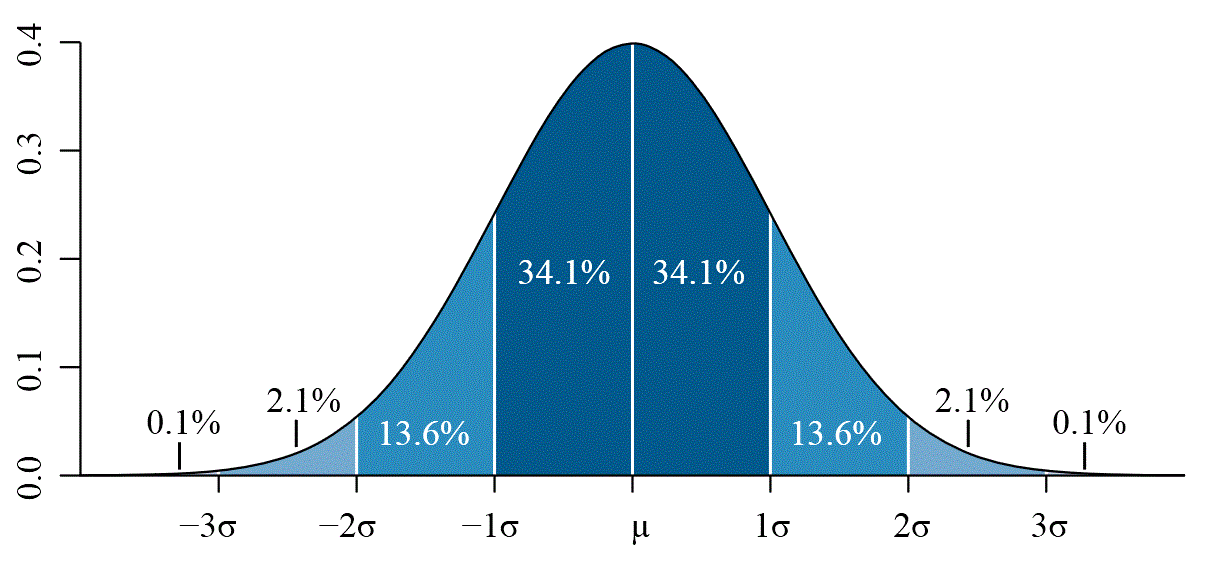
Most populations for tests have a characteristic bell-shaped curve as in the diagram, in which it can be shown that 68.2% of the population are within 1 standard deviation either side of the average, and 95.6% are within 2 standard deviations. When many of these values have been obtained from numerous laboratories, the standard error can be calculated for the test method. The more measurements that are made to determine the precision of a method, the more accurate it is and therefore standard error becomes relevant – it decreases as more measurements are made. It is calculated by dividing the standard deviation by the square root of the number of samples.
Reproducibility and repeatability
Analytical methods published by international organizations will almost always provide two measurements of standard error and both of these are statistical in nature. Repeatability (abbreviated to r) refers to the difference between two test results on an identical sample tested on the same apparatus by the same technician. Reproducibility (abbreviated to R) also refers to the difference between two test results but by different technicians in different labs. ISO 5725 provides the basic method for determination of repeatability and reproducibility of standard measurement method.
Both express the maximum expected discrepancy between two tests in terms of a 95% probability – thus there is a 95% likelihood that the difference between two results obtained by different labs will be less than R. As one would expect, there is considerably less scope for inherent unavoidable differences of the same test method in the same lab/operator compared to the different labs/operators and indeed the repeatability is often considerably smaller than the reproducibility.
Statisticians often refer to a 95% confidence limit. This means that the statistics indicates that there is only a 5% chance of the conclusion being incorrect. For a 95% confidence limit if we consider the whole distribution curve, 95% of the results lie within +/- 1.96 of the mean. This is a two-sided or two-tailed distribution:

Insight_BB_2
Adapted from photo by Unknown Author is licensed under CC BY-SA
More often (as explained later) we are only interested in the lowest or highest part in the distribution curve, in which case 95% of the results lie within 1.645 standard deviations from mean. This is called a one-sided distribution:

Insight_BB_3
Adapted from photo by Unknown Author is licensed under CC BY-SA
Conformance of analytical tests with specifications
In commercial commodity shipping, typically the product will be sampled to produce a representative sample, which is tested by a local laboratory by a standard method for each parameter. These test results are incorporated into the cargo Certificate of Quality and this is often the basis of the sales contract.
At disport, the shipper will again take a representative sample to confirm there are no quality issues. Obviously, the sampling is also critical, but we are assuming that the cargo is unchanged and the samples are identical for the purposes of this bulletin. When the cargo is well within specification, the precision inherent to the method is not critical, but when the cargo is on the borderline of acceptable quality, the precision value of each of the parameters is of relevance. Since the two ports are likely to be far away, the likelihood is that different labs are going to be used, so R (reproducibility) will be the relevant value.
Specifications will tend to be a one-tailed test, because specifications are almost always expressed as a certain parameter being “at most” (i.e. maximum) or “at least” (i.e minimum) a specified value. We are only interested in what is either above or below the parameter of interest:

Insight_BB_4
Adapted from photo by Unknown Author is licensed under CC BY-SA
If we conduct a single determination of a given test, this will give us a value to compare with the specification.
In many specific tests for various parameters, the test level should be within the maximum or minimum range and even if slightly off spec after one test, it is considered unacceptable. There are exceptions but for the remainder of this bulletin, we will focus on the case for fuel.
Fuel specifications and analytical result assessment
One area of particular interest leading into 2020 is fuel quality and particularly the sulphur cap on marine fuels, which is obviously measured as part of routine fuel testing.
For fuel analysis, specifically ISO 4259 “Petroleum and related products — Precision of measurement methods and results” and related standards, including ASTM D3244., there is an extra provision by which some leeway is given for the specific test’s reproducibility when results are borderline. There are four levels of assessment in ISO 4259.
First level of assessment
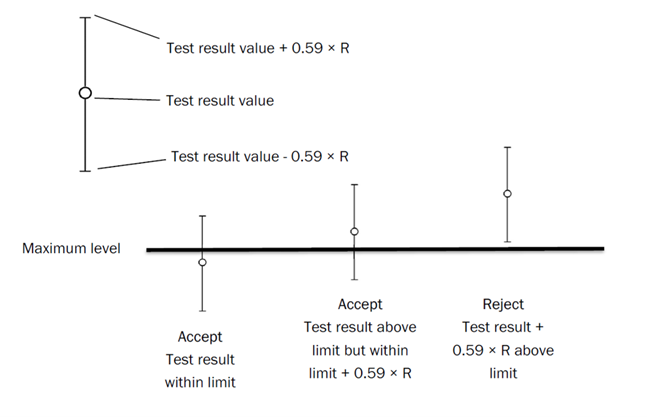
If the test result is above the specification, ISO 4259 allows using the factor 0.59 × R. When there is a maximum limit for a parameter, if the result is above the specification limit - but below the specification limit + 0.59 × R - the purchaser/receiver of the fuel should consider it acceptable.
So for example a fuel with a nominal sulphur content of 0.5% is tested using ISO 8754:2003, the acceptable limit is 0.5% + 0.59 × R, which is 0.53%
A specification limit is considered not to have been met if the result from analysis is greater than the specification limit + 0.59 × R, (so in the above example, more than 0.53%).

Insight_BrookesBell
Second level of assessment
That is not the end of the assessment process, necessarily. Standard ISO 4259 (2017) Part 2 deals with “Interpretation and application of precision data in relation to methods of test”.
In this provision, the receiver can claim that the specification limit has not been met and consequently the fuel, as supplied, failed to meet the limit and the Supplier is required to test their retained sample.
“4.3.1 Acceptability of results
When single results are obtained in two laboratories and their difference is less than or equal to R, the two results shall be considered as acceptable, and used to calculate the average X. The average X, rather than either single result separately, shall be used as the estimated value of the tested property.
…
If the two results differ by more than R, both shall be considered as suspect. Each laboratory shall then obtain at least three other acceptable results”
Third level of assessment
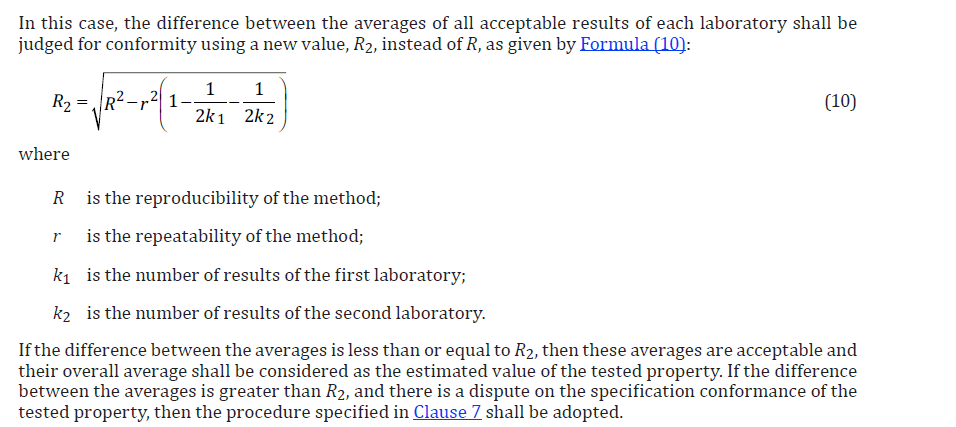
Thus at this stage, according to ISO 4259, the labs have to present three determinations of the parameter (they may already have done this to determine the figure) which is acceptable for repeatability criteria and there is a formula in ISO 4259 for determination of the estimated average:

Insight_BB_6
Fourth level of assessment
Clause 7 is detailed, and we would refer the reader directly to it at this juncture. In a nutshell, it involves the labs that are clearly obtaining significantly diverging results contacting each other and discussing test methods, equipment, setting etc. It is very rare to reach this level of scrutiny, but members should be aware of the possibilities open to them through these standard procedures.
You can learn more about sampling and testing of bunker fuel in our Insight Are you 95% confident that your very low sulphur fuel is on spec and MARPOL compliant?
Conclusions
In the normal course of analytical testing, detailed statistical calculations are not required in order to assess the results. However, with some industries, particularly the fuel trade, blending is to a very precise level and inevitably there will be borderline cases where the statistical precision of a test must be implemented to make a firm decision. ISO 4259 (and related standards) provide a codified way of doing this.


