In a navigation incident, the first line of inquiry would normally cover the bridge watchkeepers. While the human element plays a significant role in these incidents, it is perhaps worth asking, what if some geographic areas are more prone to navigation incidents than others?

Incident hot spots - a global overview of navigation incidents
Written by
Published 06 September 2021
The majority of the investigation reports tend to conclude that “human error” is the root cause of navigation incidents. Among the findings, human error generally entails; lack of situational awareness, poor lookout and competence of the mariners involved. The human error, as has been observed in several investigation reports, may well be just one of many factors contributing to the incident. There may be other factors which may not have been paid attention to during an investigation, such as geographic areas of high frequency of navigation incidents, or “navigation hot spots”.
This article will focus on our work with data on vessels movements where we look at a possible different narrative for navigation incidents. We will firstly evaluate data collected on all navigation incidents for the five year period of 2016 to 2020 to understand how geographical locations compare for collisions and groundings. Contact incidents, i.e. allisions with fixed objects, are omitted as most allisions are related to navigation during berthing/un-berthing operations. They can be complex to evaluate and do not fit the scope of this article.
Secondly, we will focus on contributing factors that lead to these incidents. Instead of human errors, we will focus on vessel behaviour. One could argue that the vessel behaviour is also linked to the humans operating the vessel, but when we look at these behaviours, we may be able to see a different pattern providing another perspective.
Before looking at our detailed analysis, we will take a look at Gard’s claims data to understand the scale of the issue.
Navigation claims in Gard
Looking at Gard’s hull & machinery claims data for the 2016 to 2020 policy years, we see a 15% increase in the number of registered navigation claims in the Gard hull & machinery portfolio. These claims, when adjusted for the growth of the number of vessels in Gard, indicate a drop in frequency, i.e number of claims per vessel, for the same period. On average the navigation claims frequency stands at 7.2%, or one in every 14 ships have had an incident in a year, aggregated for the past five years. For Gard, these claims can cost anything from zero to several million dollars depending on the incident, with an average of USD 300,000 per claim. Irrespective of the costs associated with the claim, the underlying risk factors between a high value claim and a below deductible claim can be very similar.
Movement data
The heat map below displays all the collision and grounding incidents registered in the Lloyd’s List Intelligence database for all vessels in the global merchant fleet over 5,000 GT. The bright yellow areas reflect high incident numbers compared to the light blue shades where the number of incidents is comparatively lower.
Heat map showing global groundings and collisions by region. Sources: Lloyd’s List Intelligence Casualties Data 2016-2020; Windward Predictive Intelligence Platform.
Number of incidents by geographic area
The heat map may not come as a surprise as the areas of high traffic incidents are well known to most operators and mariners. The below map shows all the areas with their respective number of navigational incidents. For the ease of understanding we have named these areas based on the general geographical boundaries defining our area of interest. These names should be used for geographical reference only.
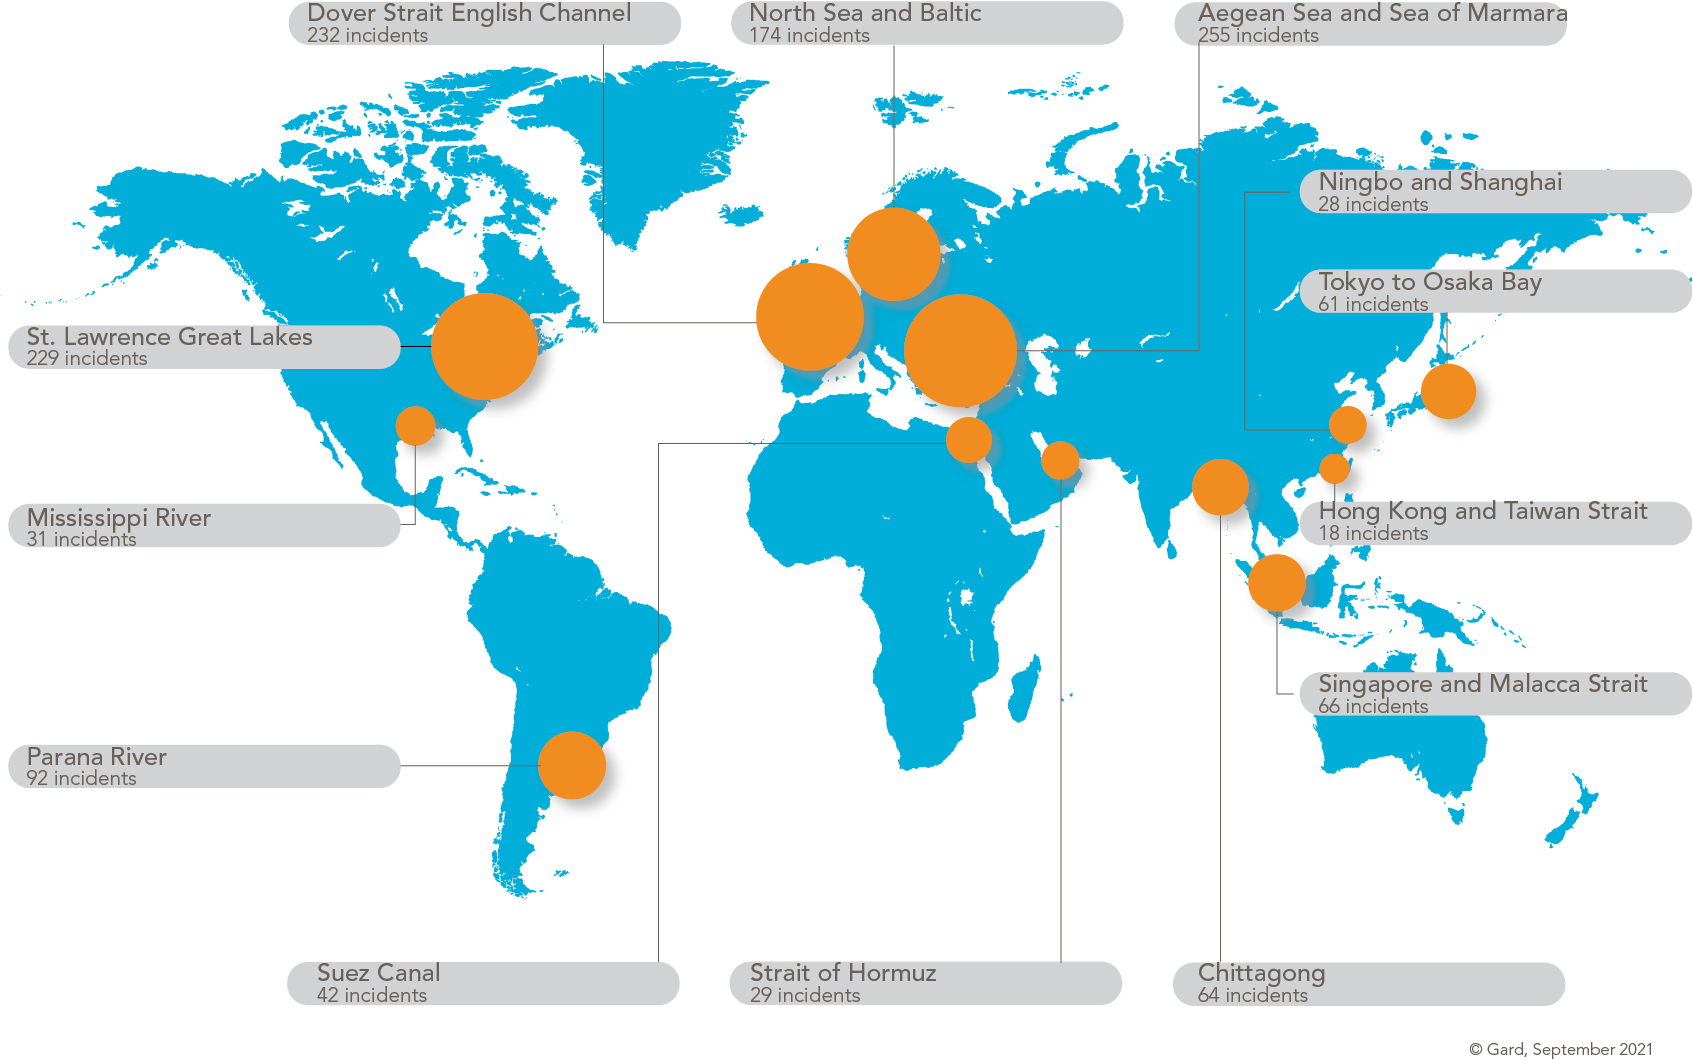
Sources: Lloyd’s List Intelligence Casualties Data 2016-2020
There are a few variables that we need to bear in mind when ranking areas with high numbers of collisions and/or groundings.
These areas are not consistent in their geographical expanse.
The traffic flows can vary between geographical locations.
The areas are exposed to different climatic conditions like winds and tidal currents.
“Sailing days”
It is difficult to quantify all the different variables, but with the help of Windward’s data insights, we have obtained a picture of the traffic density in these areas which is calculated in “sailing days” for each of the hot spots mentioned in the above map. The expression “sailing days” means the number of vessels multiplied by the amount of time (in days) they spend in each area.
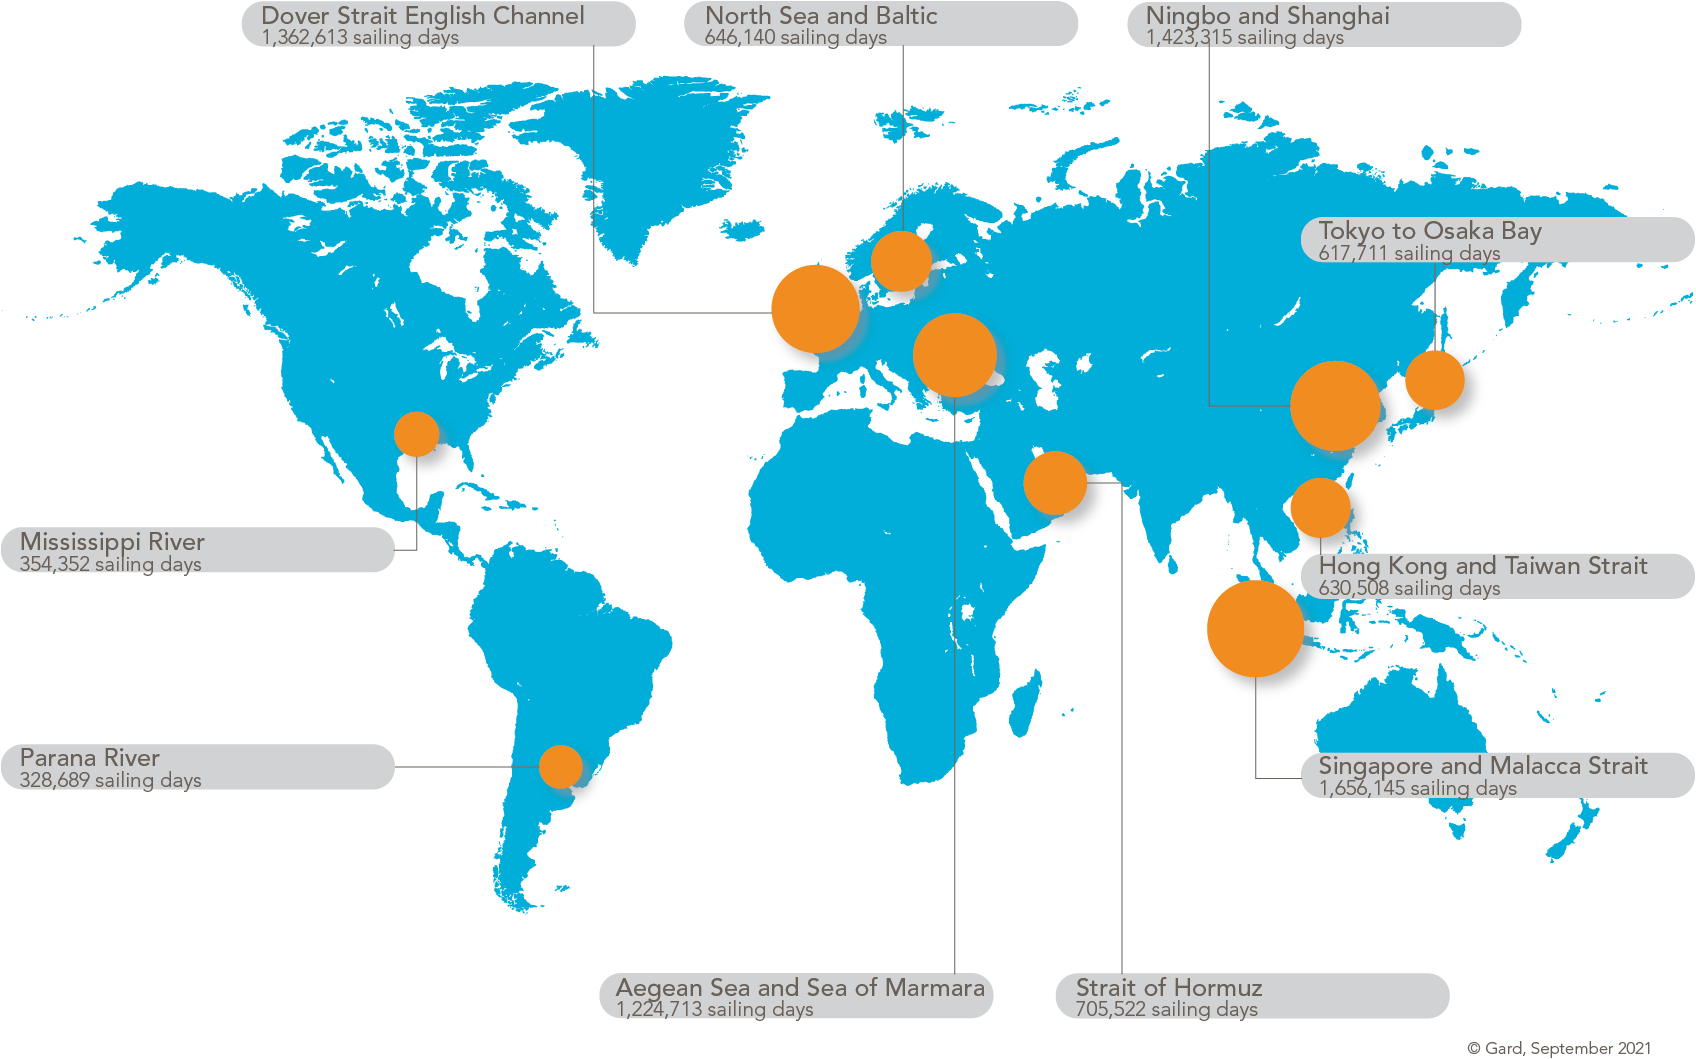
Top 10 regions for sailing days (traffic flows) per geographic area*.* Source: Windward Data Insights.
Rate of incidents for geographic areas
After allowing for the total number of sailing days, we are able to rank all the above areas with a “rate” of incidents. The rate of incident should be seen as the likelihood of an incident occurring per sailing day in the area. For the ease of understanding, we have shown the rates per 100 sailing days. The following maps show the rates for these areas by collisions and groundings combined, by collisions, and by groundings.
Top 10 areas for collisions and groundings
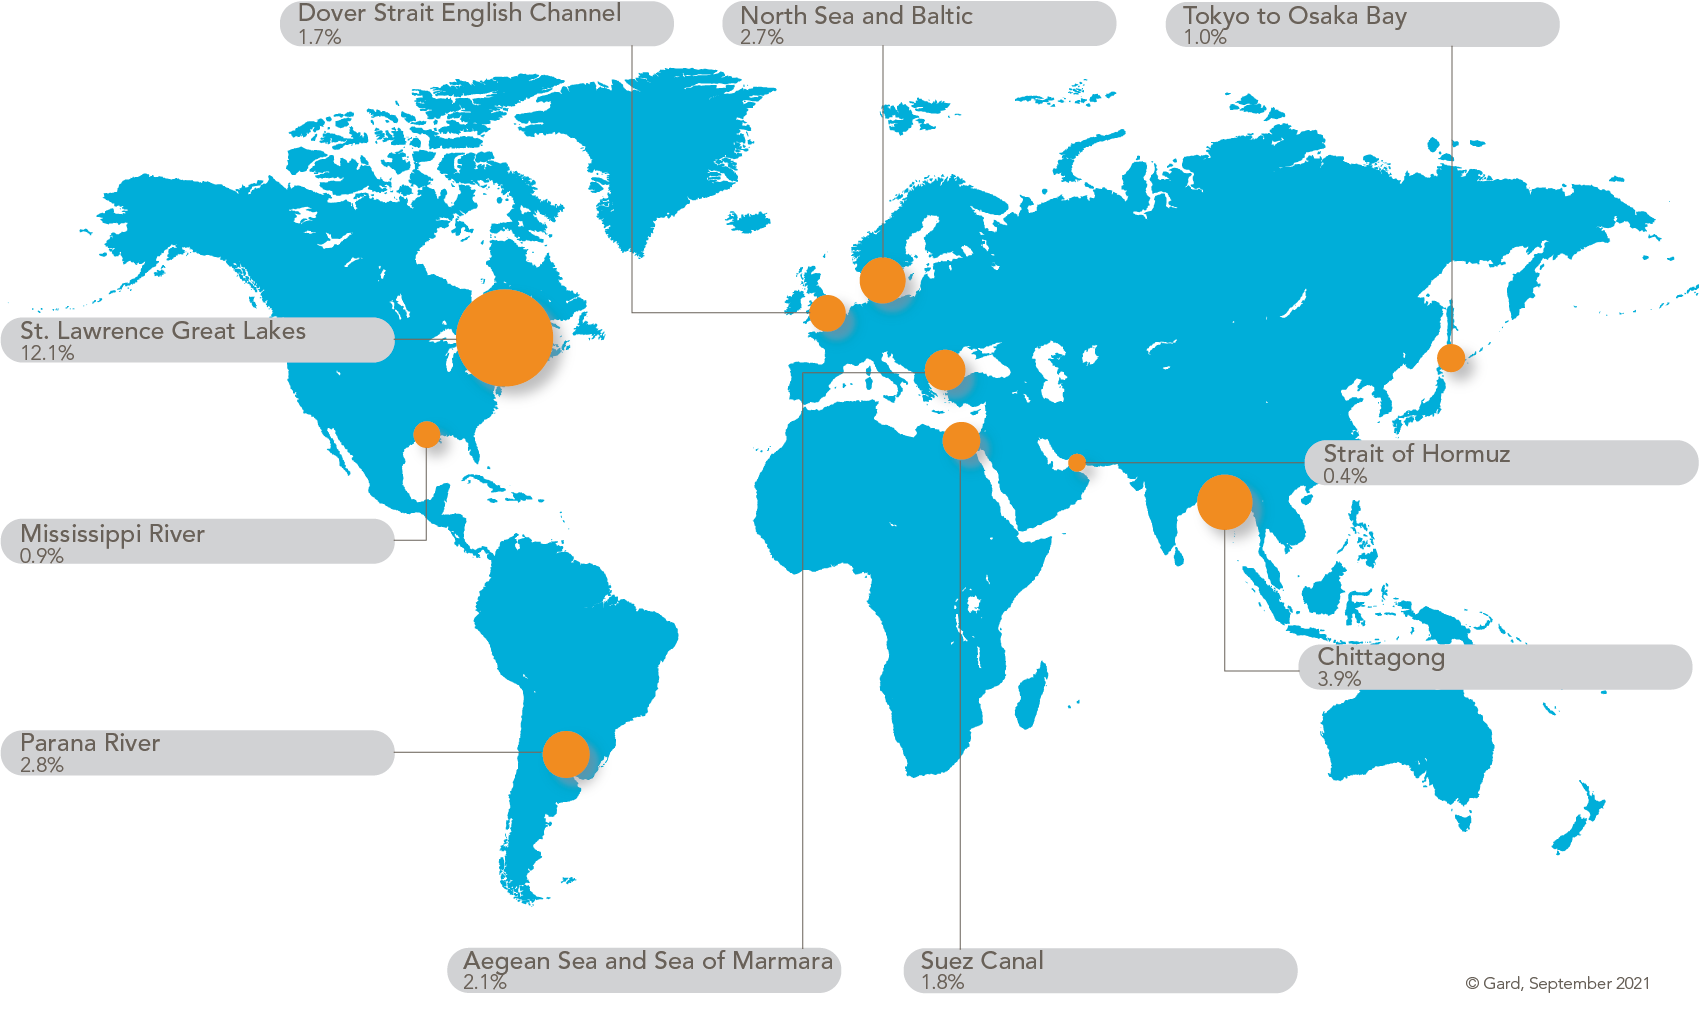
Sources: Lloyd’s List Intelligence Casualties Data 2016-2020; Windward Predictive Intelligence Platform.
Top 10 areas for collisions
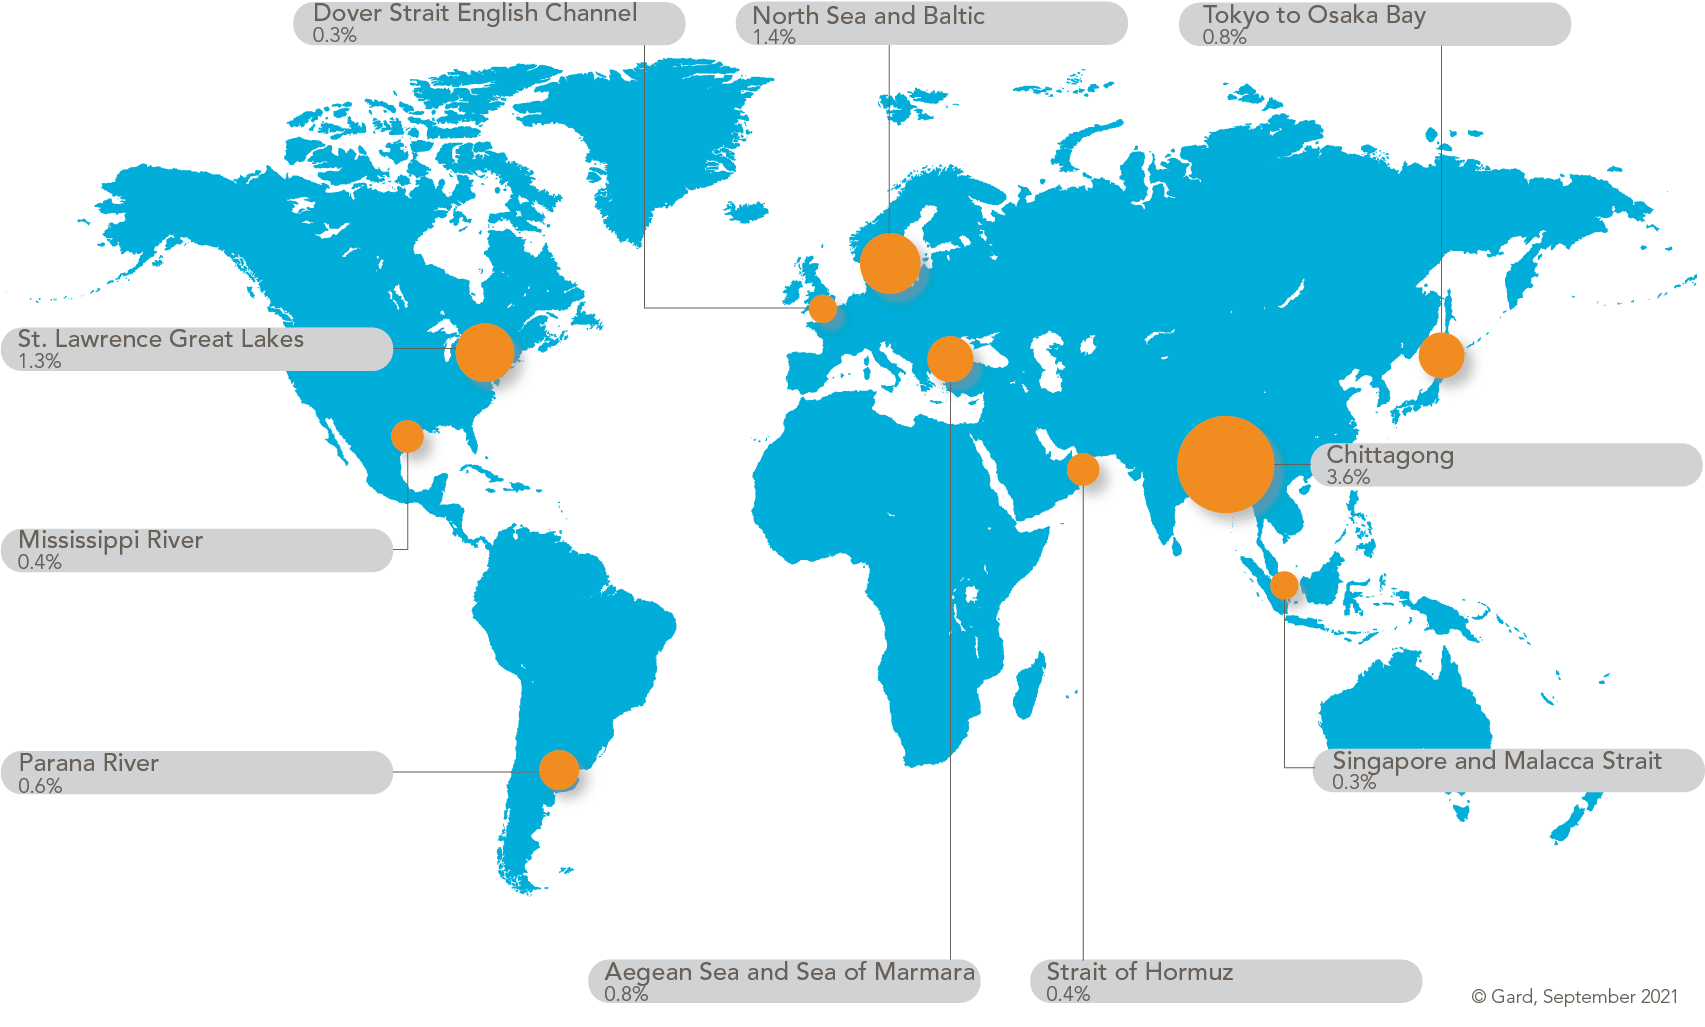
Sources: Lloyd’s List Intelligence Casualties Data 2016-2020; Windward Predictive Intelligence Platform.
Top 10 areas for groundings
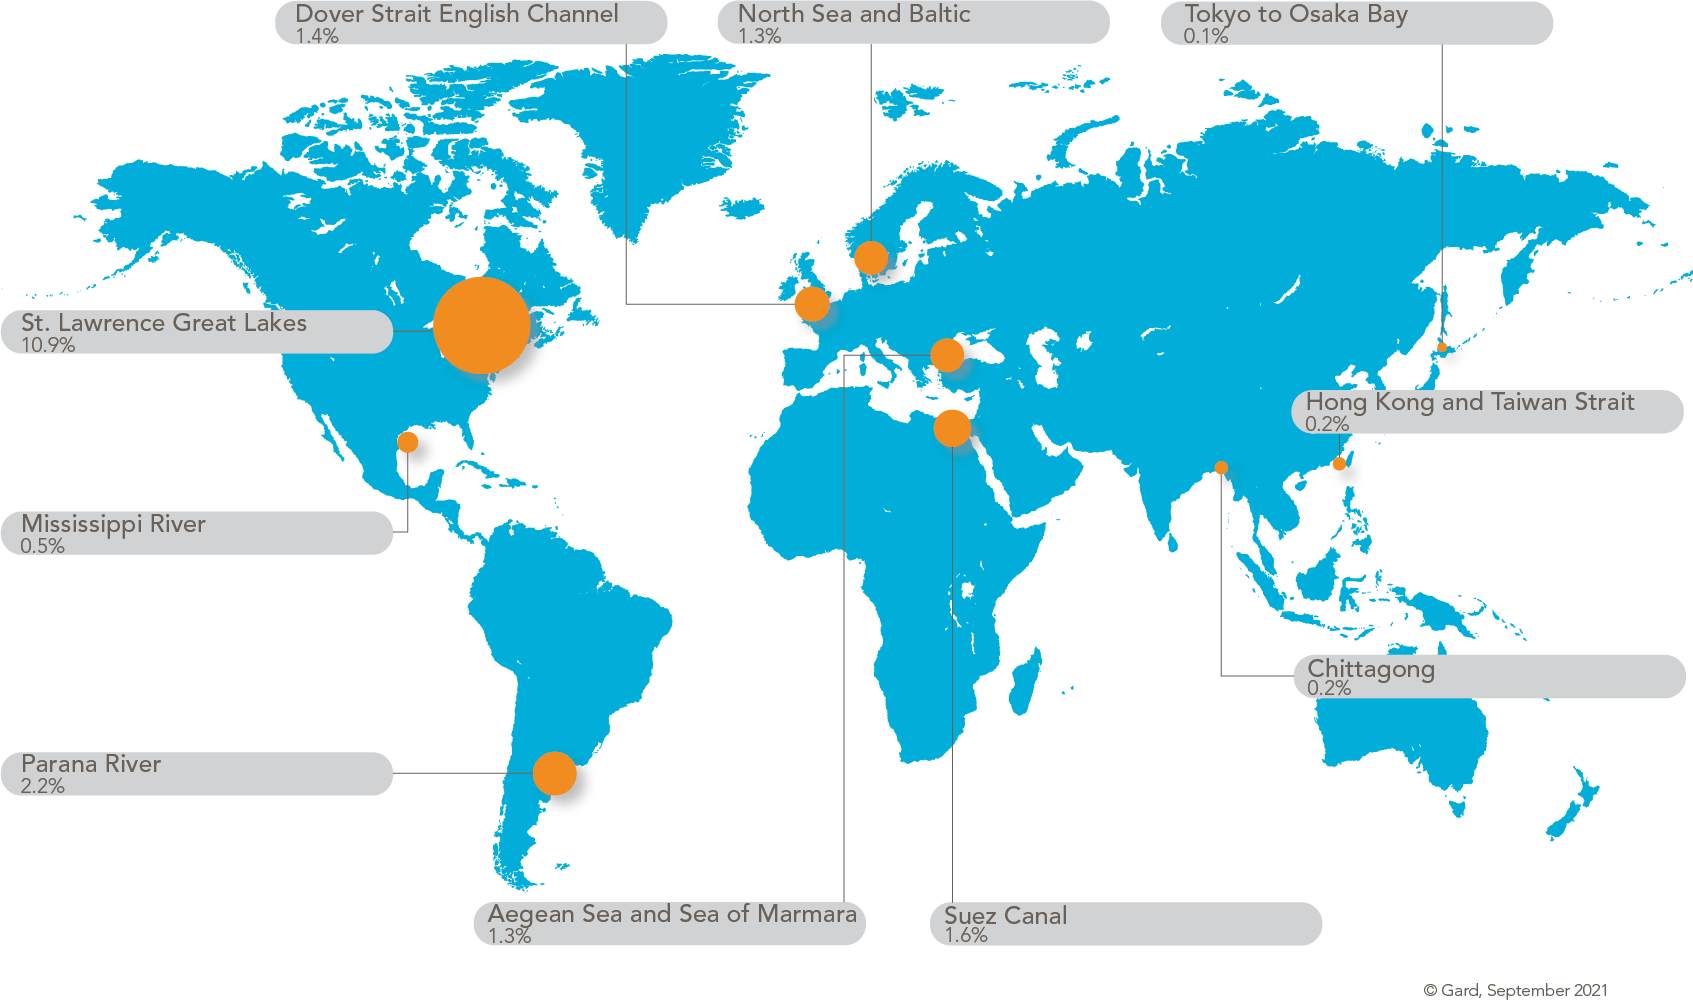
Sources: Lloyd’s List Intelligence Casualties Data 2016-2020; Windward Predictive Intelligence Platform.
Global hotspots
Mariners normally consider the areas of high traffic density as high risk for navigation. However, looking at the incidents over a time it is evident that areas such as the Singapore and the Malacca Straits facilitate the highest traffic flows in the world yet rank low for incident rates. We see a very similar picture for the Ningbo and Shanghai approaches which facilitate some of the busiest trade flows in the world yet rank amongst the lowest when we look at the incident rates.
When looking at the above rankings, it is evident that some areas are more vulnerable to groundings whilst others present a higher risk of collision. We will not assess individual areas in this article, but in general, ports with high traffic density which may be largely unregulated could contribute to high rates of collisions. Similarly, ports with significant annual and/or diurnal tidal variations may well increase the risk of groundings. While there could be several factors responsible for the ports that rank high for incident rates, some prominent factors include:
Traffic separation schemes.
Depth and width of navigable waters.
Effectiveness of Vessel Information and Traffic Systems (VTIS).
Pilot training and experience in navigating in the area.
Geographical location with respect to currents, exposure to the weather elements, and other external factors.
The above list while not exhaustive, indicates that there can be several contributing factors to navigation incidents and each area will need a thorough assessment.
Vessel behaviour
Gard’s loss prevention is focused on evaluating risk factors some of which may not be commonly discussed or addressed. In the second part of this article, we will look at whether certain vessel behaviours increase the risk of a navigation incident. For this purpose, we use AIS movement data to analyse our own claims data and evaluate the behaviours which have historically led to navigation incidents.
Claims frequency is divided into subgroups of claims of the same type, such as groundings or collisions.
In our analysis we also include static factors like type, size, and age of a vessel to control the factors that may have an impact both on claims and behavioural data. The behavioural data for a vessel should be compared to data from similar segment vessels. As an example, a VLCC would normally on average have higher nautical miles travelled in a year compared to smaller tankers. This way we can avoid “comparing apples with oranges”.
Key risk factors
The following are some of the high-risk behaviours found for grounding incidents:
Max speed relative to service speed: This risk factor is the maximum observable speed (AIS speed) during the year preceding the incident, measured as a percentage of the vessels’ service speed. “Service speed” is by definition the highest speed the vessel is designed to maintain in service at sea while underway at the deepest seagoing draft (summer draft). The higher the observable speed as compared to the service speed, the higher the likelihood of a grounding incident occurring.
River traffic: Out of the total operating time, the percentage of time the vessel is operating in a river. The higher the amount of time, the more likely the vessel is to have an incident.
Unique ports called: Out of all port calls, this risk factor evaluates the number of unique ports visited by the vessel in the year preceding the time of the incident. The risk of the unknowns when calling a port for the first time is much higher especially if the bridge team is unfamiliar with the port infrastructure.
Proportion of time in median speed (higher is better): The proportion of time the vessel is operating at the same speed as the median operating speed in a given year (measured in whole knots). The fewer speed fluctuations, the lower the risk of grounding. Number of port calls: Higher number of port calls in a year increases the risks related to grounding. This is relevant to all ports in the world and not just the hot spots mentioned in this insight.
The above risk factors can give a better understanding of grounding incidents beyond the traditional approach of human error. They also allow us to understand if there are practical control measures that can be put in place to mitigate the risk.
As an example, the risk factor related to the unique port calls cannot be mitigated by the actions of the bridge team alone. This is a commercial decision which does not account for its impact on the safety of navigation of the vessel. This is a business risk for which the seafarers are trained. However, the data tells us that training alone may not be sufficient if this risk is not accounted for during voyage planning and execution.
Case study
One example from Gard’s database is where a container vessel had two grounding incidents in one calendar year. Both grounding incidents occurred during the first or the second call to a new port following a change in the liner service schedule by the shore commercial operators. This risk is further amplified if the vessel is expected to visit a port which may not have good port infrastructure. A review of the high risk areas listed above could provide some guidance to the vessel operators and navigators.
Collisions
Grounding and collisions fall within ’Navigation claims’ for most insurers. However, the associated consequences and risk factors could be very different. The type of casualty response can be very different for a collision as compared to a grounding which is also reflected by the costs associated with the handling of the case. Not only are these claims different in their response planning and its impact on claims costs, they also have very different risk factors according to our analysis. The below list highlights the risk factors that show a strong correlation with collision incidents.
Time anchored: Out of the total operating time, the percentage of time the vessel is at anchor. The longer a vessel stays at anchor the higher the risk of a collision. This risk factor may sound counterintuitive unless we actually look at the number of collision incidents for vessels at anchor, especially for those vessels anchored around busy traffic lanes.
Max speed relative to service speed: The maximum observable speed during the last year, measured as a percentage of the vessel’s service speed. This is a common factor between grounding and collision claims.
Calls to large ports: The higher the traffic in a port, the higher the risk factor associated with the port. This may not align with our earlier analysis where we looked at the comparison between the density of traffic vs the rate of the incidents. We measure the size of a port by the number of vessels calling the port in a given year and the average size of a port is measured relative to the average of other similar vessels.
Accelerations: Out of the total operating time, the share of time the vessel spends accelerating more than 1.2 km/minute. Movement data provides us clear correlation between frequent accelerations and collisions.
Mileage: The higher the total nautical miles travelled by a vessel in a year, the lower the risk of collision.
Case study
A case example of the impact of acceleration is a common observation where a vessel starts to increase speed after dropping off a pilot. The vessel in this case was a small tanker that dropped the pilot at 1244 GMT when the speed over ground was 7 knots. Soon after dropping the pilot the vessel entered the traffic separation scheme and started to increase speed from dead slow to half ahead. Given the prevailing currents, the vessel’s speed increased to 14.2 knots by 1300 GMT and further to 16.5 knots just before a collision with a crossing vessel in the traffic lane. From the VDR replay the chaos on the navigation bridge was quite evident.
How to benefit from the information in this article
The purpose of this article is to approach navigation related incidents from a different perspective. The insights are largely data driven either through reported incidents or through vessels’ AIS movements.
Static vs dynamic risk assessment: We recognise the efforts of our members and clients to conduct regular navigation audits, voyage risk assessments and other forms of surveys. These surveys, as important as they are for regulatory compliance, provide a limited risk picture. Most surveys and audits are based on the evidence provided at the time, which makes the assessment good for the period of the audit. Navigation audits and risk assessments do not take geographic risks into account, nor the risks associated with a certain trade pattern on vessel behaviour. An understanding of the global hotspots along with risk behaviour provides a more dynamic picture of the risk. As an example, when vessel operators appoint a unique port of call for the vessel, the voyage risk increases, especially for grounding incidents. Similarly, vessels that accelerate rapidly upon “drop of pilot” tend to have a higher propensity of collisions compared to those that accelerate more slowly. These factors need to be assessed and discussed with the bridge team during voyage planning. Knowledge of some of these known risks would help members manage and mitigate them better.
Safety of navigation: Safety of navigation largely lies with the bridge team, which also includes the support from the engine department. The support role of the shore operation is seldom recognised when it comes to executing a voyage safely. In Gard, the highest number of loss prevention queries from our clients and members request information about port and geographical risks This clearly indicates that the vessel operators generally take a holistic view in ensuring safety of the vessel and the crew and the information in this article is designed to support such initiatives by the vessel managers. While the port risk ranking would change over time and perhaps with better data, a global navigation risk picture, supported by data, could provide operators with relevant information to support the bridge team. The information provided in this article is designed to support the cross functional approach toward safety of navigation.
Investigating navigation incidents: The majority of investigations into navigation incidents indicate “human error” as the root cause of the incident. It is seldom that an investigator tries to reconstruct the incident to fully understand the circumstances of the incident. What if all actions performed to avoid the incident were in compliance with the duties of the bridge team? What if the bridge team had performed similar manoeuvres successfully in the past to avoid the incident? Our investigation methods could very well be as static as our approach to navigation audits and therefore do not consider the dynamic nature of navigating a vessel through ever changing risks. As an example, when a vessel is on a tight port rotation, we recommend our members and clients consider the heightened risks of a navigation incident and advise their bridge team accordingly. Similarly, we recommend expectations to the master are managed when the vessel is likely to call a congested port or for that matter unique port where the vessel may not have called in the past. For those on shore making commercial decisions, it is important to factor in safety of navigation in the decision process.
Disclaimer
The purpose of this insight is to generate an overview of navigation incidents around the world.
The incident numbers used are all reported incidents in the Lloyd’s List Intelligence database. It is likely that several smaller incidents go unreported, and the figures may change as additional incidents are reported in a region.
The appropriate use of our LP insights would be for shipowners and their navigating officers to evaluate their own risks during voyage planning as well as execution.
This article should not be used for commercial purposes or for dispute resolution. The information is for loss prevention purposes only.
About our data providers
Given the prevalence of AIS (Automatic Identification System) movement data, it becomes relatively straight forward to see the most vulnerable geographical areas for navigation related incidents. We used Windward AI platform as our data partner to run the analysis for us. Windward is the leading Predictive Intelligence company fusing AI and big data to digitalize the global maritime industry, enabling organizations to achieve business and operational readiness. Winward’s AI-powered solution allows stakeholders to make real-time, predictive intelligence-driven decisions, providing a 360° view of the maritime ecosystem and its broader impact on safety, security, finance, and business.
Lloyd’s List Intelligence, the trusted expert partner in maritime data for 300 years, was the first maritime casualty reporting service started in 1803. Today their expertly managed database, containing billions of data points that are constantly verified and contextualised with the use of AI, is at the core of a suite of online tools and data feeds helping thousands of professionals save time collating and interpreting maritime data to get a clear view of risk, monitor maritime trade and seize opportunities.


